Akhmad Fauzi Nurulhamzah / Bogor, Indonesia

Applied data science, grounded in real-world industry experience.

I build data-driven solutions with machine learning, statistical analysis and computer vision, informed by more than 12 years in forestry and internal audit.

My master's thesis trains one RGB-D network to find trees, name their species and estimate trunk diameter from a single under-canopy image. Over 8 of my years in forestry were in internal audit, where the job was to ask what a reported number actually rests on. That habit shapes how I design experiments and report results: controlled comparisons, end-to-end evaluation, and an honest account of what did not work.

Read the thesis GitHub LinkedIn anurulhamzah@gmail.com

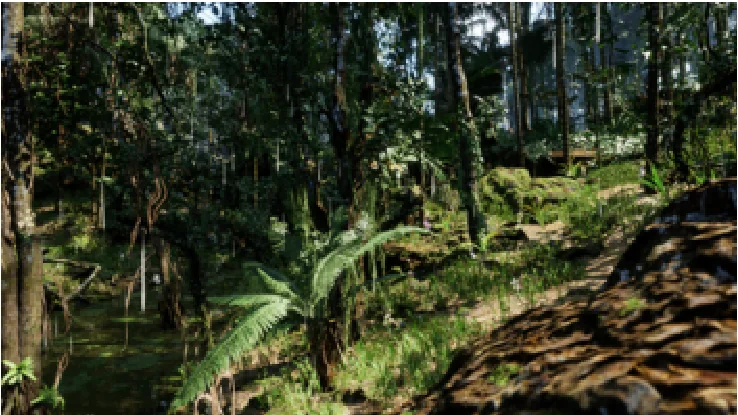
Ground-level view under a dense rainforest canopy: tree trunks, ferns and vines.
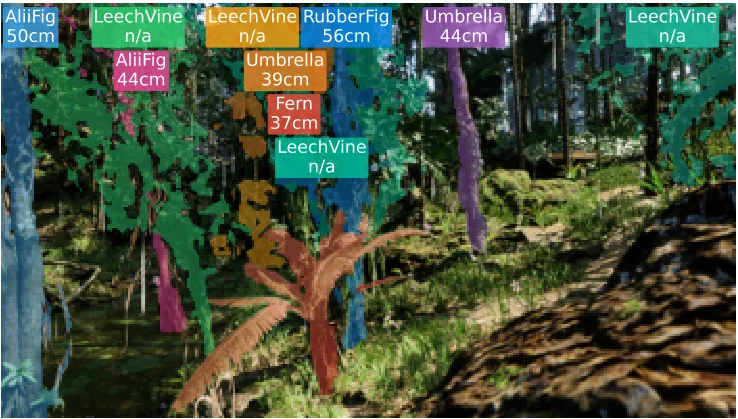
The same scene with coloured instance masks over individual trees and labels giving predicted species and trunk diameter in centimetres, for example Umbrella 39 cm and RubberFig 56 cm.
Test-split scene from my thesis model. Labels give predicted species and diameter at breast height; n/a where no valid breast-height row was found. Synthetic imagery (SPREAD dataset).
Education
Master of Data ScienceMonash University Indonesia, 2024-2026, LPDP scholar
Thesis grade
High Distinction (80/100)Manuscript in preparation for Ecological Informatics
Industry
12+ years in forestry8+ years in internal audit
Thesis result
62.29% AP50, 7.62 cm RMSESynthetic test split; diameter on detected trees

01 / Research

Thesis: one photo instead of a diameter tape

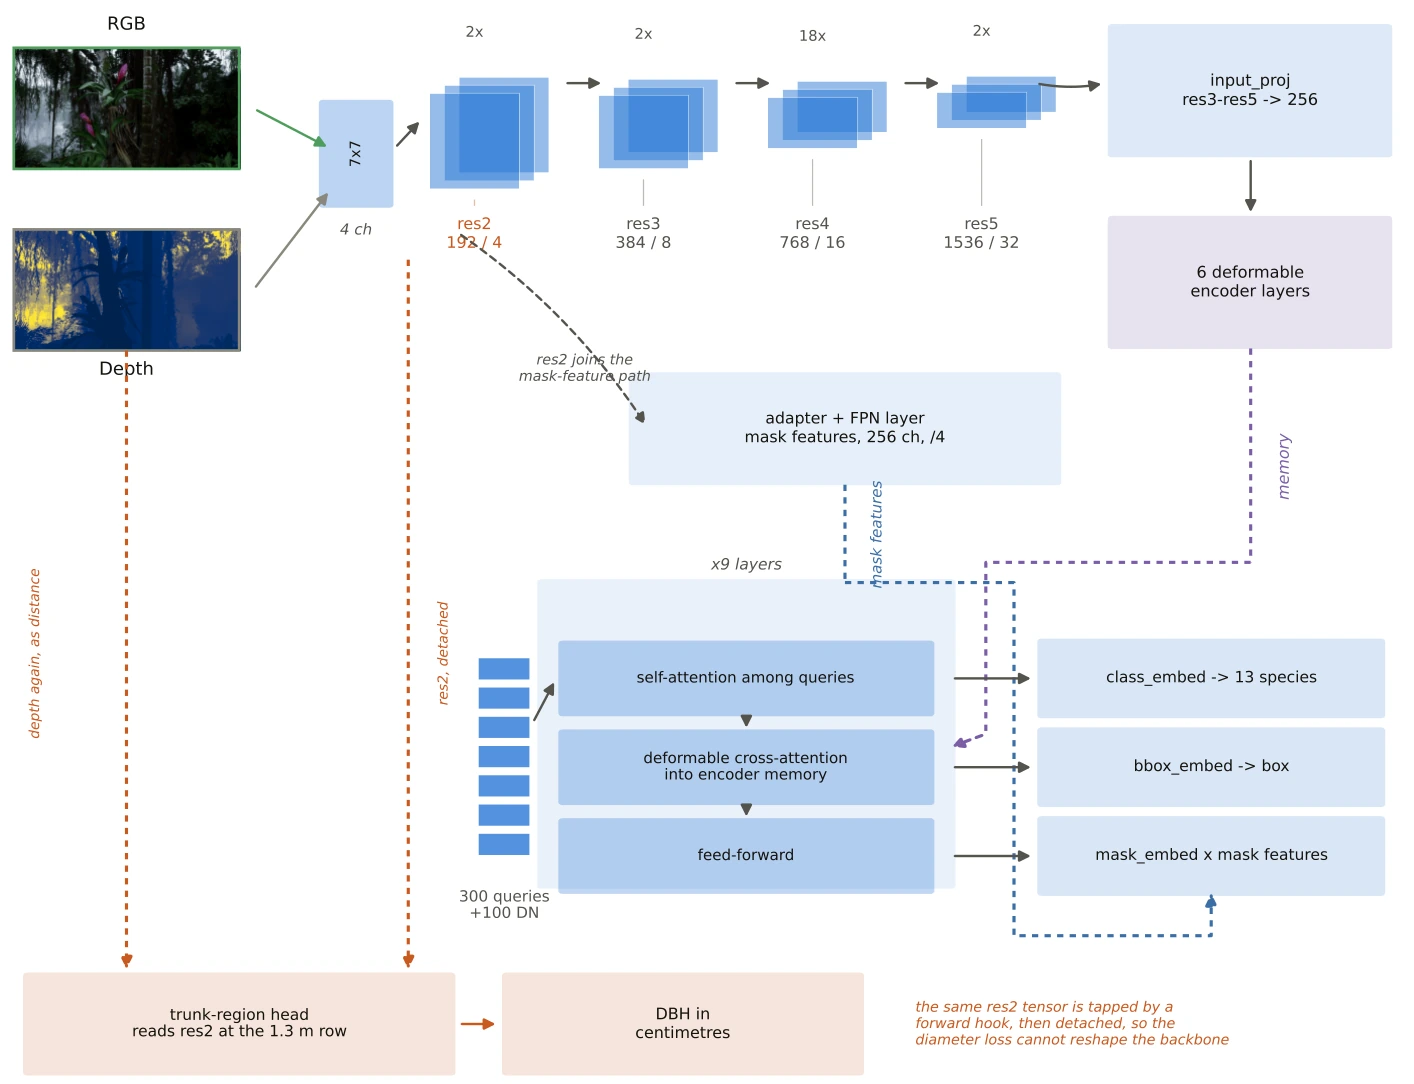
Architecture diagram. RGB and depth form a four-channel input to a FocalNet-L backbone feeding a MaskDINO decoder that outputs species, box and mask. A separate trunk-region head reads the res2 feature at the 1.3 m row and outputs diameter at breast height in centimetres.
Model architecture from the paper: one backbone, a segmentation decoder, and a diameter head that reads the 1.3 m row through a stop-gradient.

Multitask learning for tree instance segmentation and diameter estimation from RGB-D imagery

Forest inventories turn standing trees into numbers that carbon and policy decisions depend on, and in Indonesia they are still mostly measured by hand. I extended MaskDINO with a FocalNet-L backbone to accept a fourth, depth channel, and added a head that estimates diameter at breast height (DBH) from backbone features at the 1.3 m row. One network returns species-aware instance masks and diameters in a single pass.

62.29%test AP50, species-aware segmentation
7.62 cmDBH RMSE, end-to-end on own detections
+12.92AP50 points from adding depth (controlled)

Read with care. All data is synthetic (Unreal Engine 5), and diameter is returned for about 27% of eligible trees; most of the shortfall is trees the model never detects. The case study states these limits next to the results.
Read the full case study Code on GitHub

02 / Selected projects

Two more case studies, with the evidence

All project code on GitHub

  1. 01

    Student retention and dropout prediction

    Segmented 4,424 student records, tested risk factors statistically and benchmarked three classifiers with 10-fold cross-validation. XGBoost reached 78.5% test accuracy; the transitional "Enrolled" group is where it is weakest.

    • Python
    • scikit-learn
    • XGBoost
    • KMeans / PCA

    2026
    Individual project

    Case study
  2. 02

    Regional food security and vulnerability dashboard, Indonesia

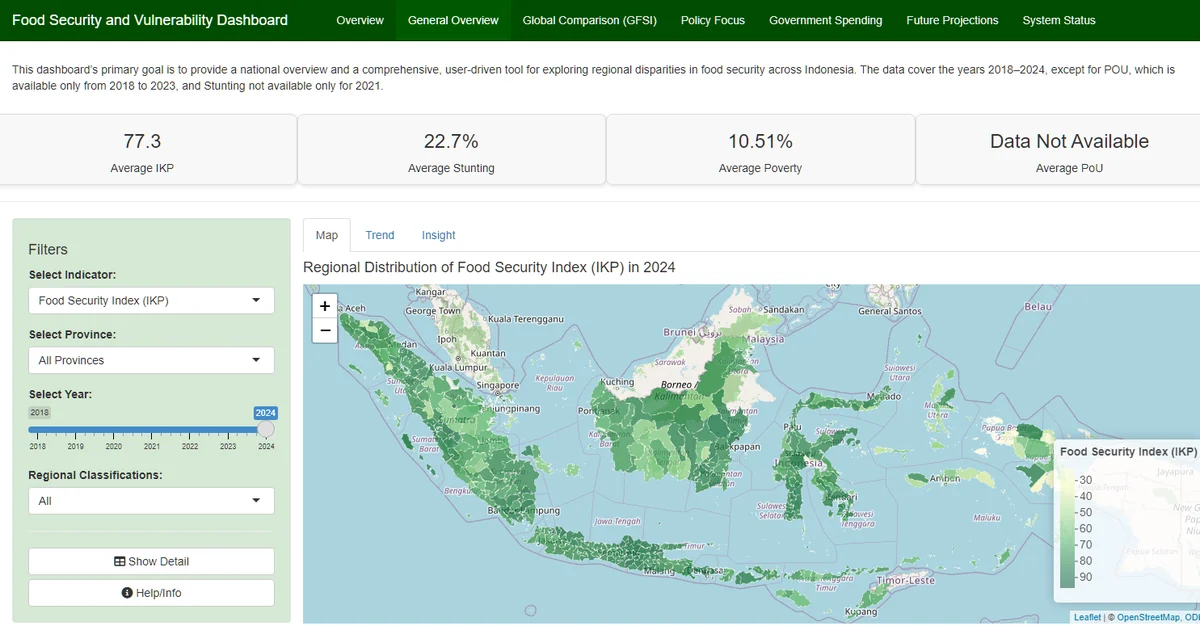
    An interactive R Shiny dashboard on food security, poverty and stunting (2018-2024), with geographically weighted regression for local drivers and ARIMA projections to 2030 against the 2030 goals.

    • R Shiny
    • GWR
    • ARIMA
    • Five Design Sheets

    2025
    Team of 3
    Live dashboard

    Case study

Beyond forestry: the same methods in other domains

  • Finance and insurance riskA Bayesian network for insurance risk with sensitivity analysis, and a CRF that tags mergers, acquisitions and earnings in financial text. Project work on benchmark data.
  • Risk, controls and complianceOver 8 years of internal audit: assessing internal controls and risk management against regulations, leading audit teams, and reporting findings to management.
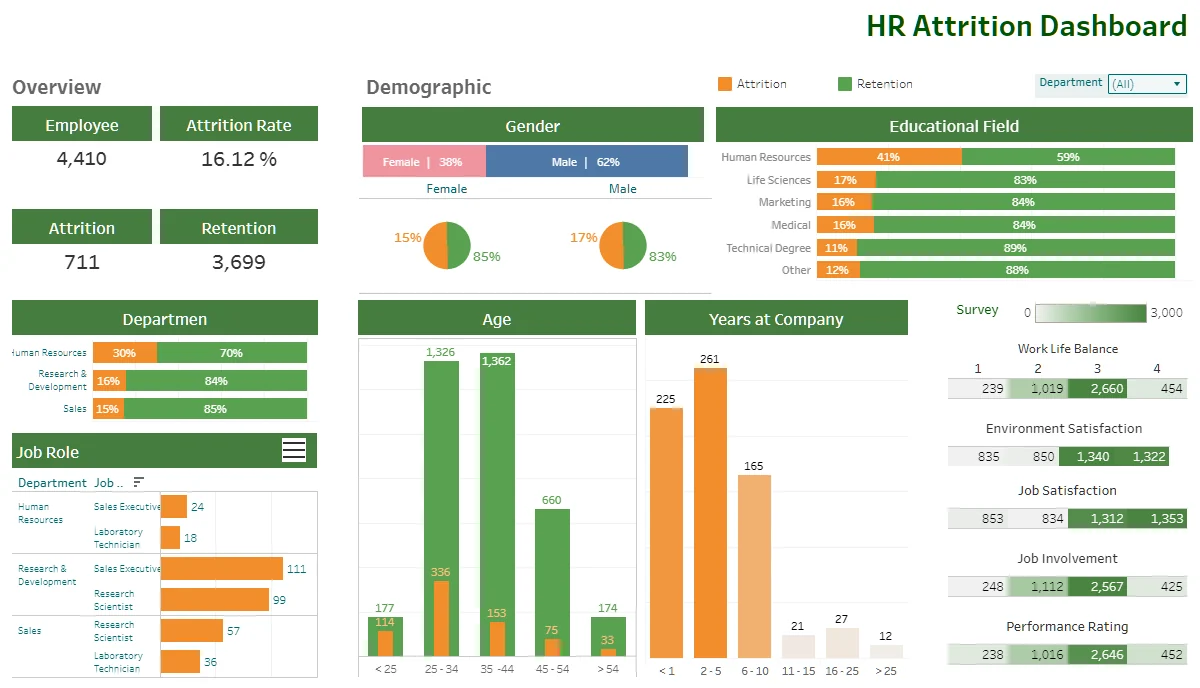
  • HR and people analyticsAn attrition analysis and dashboard built to find which factors to address to bring attrition from 15% to 10%.
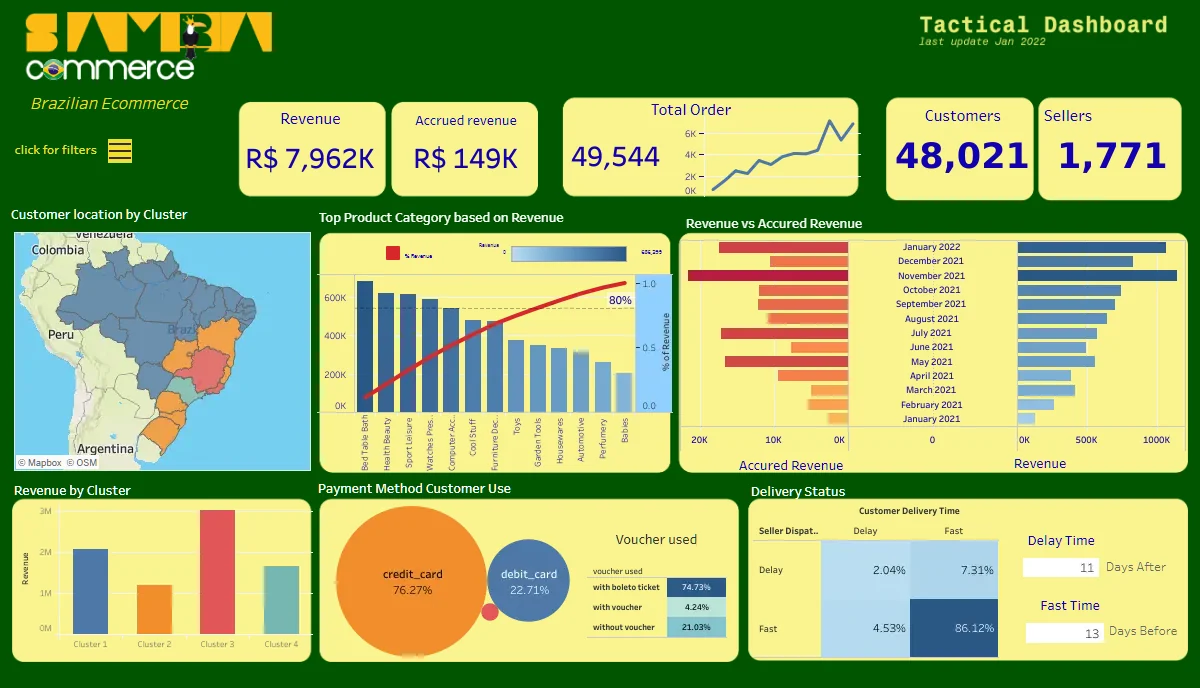
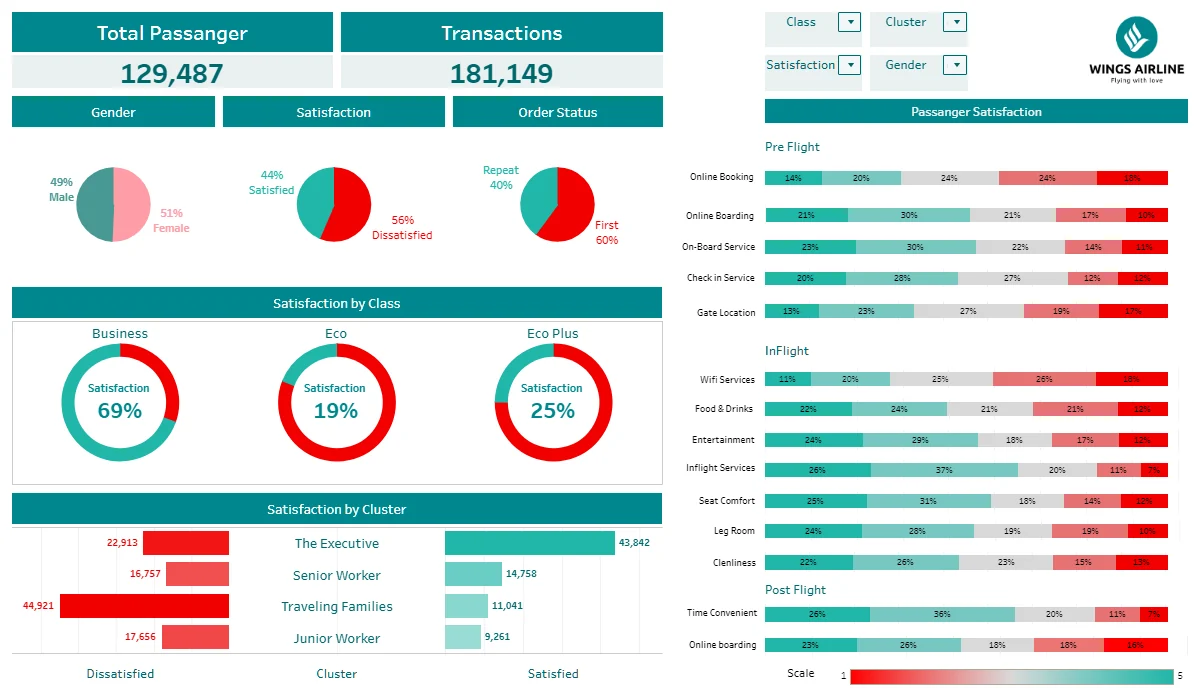
  • E-commerce, marketing and customer experienceExecutive and tactical dashboards, growth and retention analysis in SQL, A/B testing of three promotions, and an airline passenger satisfaction study.
  • Education and public policyStudent dropout prediction, and a food security dashboard for policymakers with forecasts against national goals.

More projects

04 / Approach

How I work, from raw data to results

The stages my projects follow, each with an example from the work itself.

  1. 01

    Acquire

    Know where the data comes from and what it cannot say.

    • Thesis: SPREAD, a synthetic dataset from a third party; the page states that nothing was tested on real images.
    • Climate: a synthetic panel, checked against EDGAR, NOAA and FAOSTAT patterns before use (case study).
    • Food security: regency-level indicators combined with global index data and agricultural subsidy figures (case study).
  2. 02

    Audit

    Check the data before trusting a model built on it.

    • Thesis: every annotation box compared with its mask, and the mask union with a semantic mask, in all images before any training.
    • Climate: summary statistics exposed negative pesticide and fertilizer values.
    • Food security: zeros in the stunting and undernourishment columns were found to be missing values.
  3. 03

    Clean

    Fix it, keep the original, measure the effect.

    • Thesis: 416 masks (0.8% of instances) repaired into a new folder. The fix added 1.7 AP50 for a pretrained RGB model and changed nothing for RGB-D trained from scratch.
    • Climate: 19 impossible rows (0.19%) removed, with the reason written down.
    • Missing, dirty and outlier values, and text parsing, in two wrangling projects.
  4. 04

    Prepare

    Build the split so the test is honest.

    • Thesis: split by rendered scene so one tree never sits on both sides, with a check inside every training script.
    • Climate: one preprocessing recipe applied to training and test data, to prevent leakage.
    • Retention: a held-out set of 885 students, scored once (case study).
  5. 05

    Model

    Start from a baseline and change one thing at a time.

    • Thesis: a Mask R-CNN reference, a geometric diameter baseline and six backbones; both arms of the depth comparison trained from scratch.
    • Retention: logistic regression before Random Forest and XGBoost.
    • Climate: mixed-effects models, then GAMs, a Random Forest and causal forests, each chosen for a stated reason.
  6. 06

    Evaluate

    Measure what would be deployed, and where it fails.

    • Thesis: diameter scored on the model's own detections; recall split by camera distance and by occlusion (results).
    • Retention: cross-validation, then one hold-out; the weakest class (Enrolled, recall 0.37) is reported.
    • Bayesian and CRF project: F1 on training, validation and test data to check for overfitting (case study).
  7. 07

    Communicate

    Say what the result does and does not show.

    • Interactive R Shiny and Tableau dashboards for readers who will not open a notebook (dashboards).
    • Project pages and READMEs list limitations and what is not included.
    • Thesis page: diameter is returned for about 27% of eligible trees (limitations).

05 / About

From forest operations and audit to machine learning

I started in forestry planning and environmental work in 2010: annual work plans, GIS mapping of harvesting and planting blocks, and the documentation behind Indonesia's forest sustainability and timber-legality certifications. From 2013 I worked in internal audit across four forestry operating units, testing whether internal controls and risk management matched regulations and procedures, and leading audit teams of two to three.

Moving into data science in 2023 and completing a Master of Data Science at Monash University Indonesia in 2026 extended that work rather than replacing it. Audit taught me to separate a claim from the evidence for it. Forestry taught me what an inventory number is used for and how field conditions distort it. Machine learning gave me tools to automate the measurement itself.

I am looking for applied machine learning, computer vision, data science and analytics roles, including forestry, environmental and carbon-accounting data work, and any role where an understanding of forests, environmental data, or controls and risk is an advantage.

06 / Skills

Skills, with where they are used

Machine learning and computer vision

PyTorch, Detectron2, scikit-learn, XGBoost, deep learning, instance segmentation, multitask learning, Bayesian networks (pgmpy), Conditional Random Fields, HPC/SLURM model training.

Used in: thesis, student retention, Bayesian network and CRF

Programming and data analysis

Python, R, SQL (Google BigQuery), data wrangling, exploratory data analysis, hypothesis testing, regression, clustering, big data processing.

Used in: student retention, climate analysis

Statistics and causal inference

Propensity score weighting, causal forests, linear mixed-effects models, generalized additive models.

Used in: climate analysis

Visualization and business intelligence

Tableau, Looker Studio, R Shiny.

Used in: food security dashboard, Tableau dashboards

Geospatial analysis

ArcGIS, geographically weighted regression.

Used in: food security dashboard, planning survey work

Forestry, risk and internal audit

Risk assessment, internal controls, regulatory compliance, forest certification documentation (PHPL, PHTL, VLK, TLTV), AMDAL monitoring, project management, stakeholder engagement.

Used in: professional experience

07 / Experience

Employment, study and training

Employment

  1. Internal Auditor

    Araya Bumi Indonesia (Djarum Forestry)

    • Ran recurring internal audits, about one to two a month, across four forestry operating units (PT SPA, PT DML, PT SRL, PT WHP), assessing internal control and risk management against regulations and SOPs.
    • Lead Auditor on selected engagements, directing teams of two to three through examinations and tests across Operations, Human Resources and Financial Information.
    • Delivered findings and improvement recommendations to site management.
  2. Continuous Improvement Specialist

    Satria Perkasa Agung (Sinarmas Forestry)

    • Monitored adherence to SOPs and tracked monthly district performance; documented information for improvement projects.
  3. District Environmental Officer and Planning Survey Specialist

    Satria Perkasa Agung (Sinarmas Forestry)

    • Supported AMDAL (environmental impact assessment) monitoring and conservation operations under the Conservation Management Plan.
    • Maintained documentation for forest sustainability and timber-legality certifications (PHPL, PHTL, VLK, TLTV), keeping district records audit-ready.
    • Prepared work plans and budgets for the Planning Survey Department, and tracked the district operational plan against planning indicators.
    • Produced GIS maps for the Annual Work Plan (RKT), delineating harvesting and planting blocks, and mapped planting and harvesting measurements with operational teams.

Education and training

  1. Master's degree and academic research

    Master of Data Science

    Monash University Indonesia. LPDP scholarship awardee. WAM 71.9/100.

    • Thesis grade High Distinction (80/100), supervised by Dr. Muhamad Risqi Utama Saputra. See the thesis case study.
    • Coursework: data exploration and visualisation, data wrangling, statistical data modelling, applied data analysis, data processing for big data, databases, Python programming, IT research methods, project management.
  2. Non-formal training

    Full Stack Data Analytics

    RevoU. Cumulative score 100/100.

    • SQL, Python, Excel, Tableau and Looker Studio, hypothesis testing and regression.
  3. Bachelor's degree

    Bachelor of Forestry Science

    Bogor Agricultural University. GPA 3.09.

    • Thesis on occupational health and safety in timber harvesting at a community forest cooperative.

Certificates

  • IRCA Quality Management System Lead Auditor/Auditor Training Course, TUV Rheinland (Nov 2017)
  • Comprehensive Risk Based Audit, Mutual Resources (Oct 2015)

08 / Earlier work

Analytics case studies, 2023

Before the master's degree I built business-analytics case studies in spreadsheets, SQL, Python, Tableau and Looker Studio. They are collected in a separate portfolio, and the code and reports are on GitHub.

Open the 2023 analytics portfolio Reports on GitHub

  • Divvy bike sharingTime-series and root-cause analysis of bike sharing usage.
  • Airline passenger satisfactionRegression, clustering and classification. A team project where I was project manager. Dashboard
  • Samba e-commerceExecutive and tactical dashboards. Dashboards
  • HR attritionAttrition analysis and dashboard. Dashboard
  • Property listings, Kuala LumpurExploratory and regression analysis of listing prices.
  • Fast-food marketing campaignThree promotions compared with A/B testing.
  • The Look e-commerceGrowth, cohort and retention analysis in SQL.

09 / Contact

If the problem involves forests, measurement or risk, let's talk.

Open to applied machine learning, computer vision, data science and analytics roles across industries, including forestry, environmental and carbon-accounting data work, finance and risk, and people analytics. Email is the fastest way to reach me.