Home / Dashboards

Dashboards you can open and filter

Four dashboards: an R Shiny app on food security in Indonesia, and three Tableau dashboards for business cases. Select a preview, or the button beside it, to open the live dashboard, where every filter works.

The previews are screenshots, so this page loads nothing from Tableau or shinyapps.io until you follow a link. The Tableau dashboards are from 2023 and the R Shiny app from 2025.

Airline passenger satisfaction

Tableau Public / 2023

  • Passenger and transaction totals, with gender, satisfaction and first-time versus repeat split.
  • Satisfaction by cabin class and by passenger cluster (The Executive, Senior Worker, Traveling Families, Junior Worker).
  • Pre-flight, in-flight and post-flight touchpoint ratings, filterable by class, cluster, satisfaction and gender.

A team case study (Team J, four people) in which I was project manager. The analysis used correlation, regression, cluster analysis and classification models.
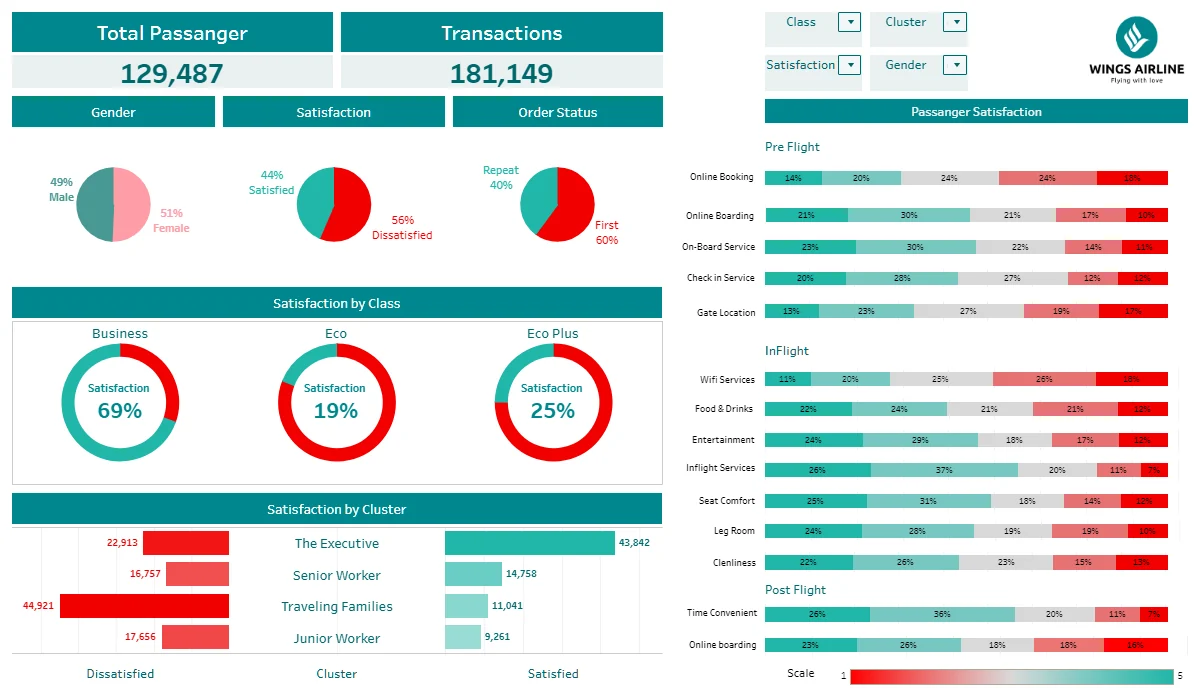
Teal airline passenger satisfaction dashboard: totals of passengers and transactions, pie charts by gender, satisfaction and order status, satisfaction by class and by cluster, and rated touchpoints before, during and after the flight.
Airline passenger satisfaction dashboard (screenshot).

E-commerce: executive and tactical dashboards

Tableau Public / 2023

  • Executive: revenue, average order value, orders, customers, sellers, monthly sales against orders, top 10 sellers, orders per quantity and customers by Brazilian state. Filters for product category, time period, city and state.
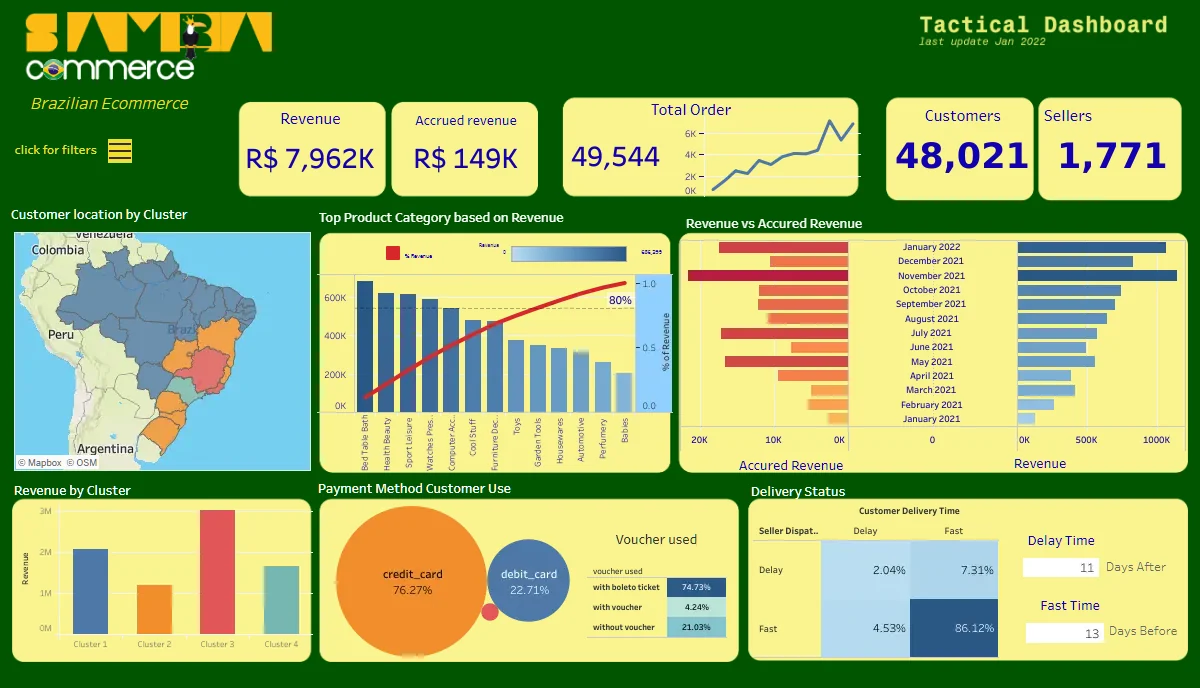
  • Tactical: revenue against accrued revenue, order trend, customer clusters on a map, top product categories by revenue with a cumulative share line, payment methods and delivery status.
Green and yellow tactical dashboard for a Brazilian e-commerce company: revenue, orders, customers and sellers, a map of customer clusters, top product categories by revenue, payment methods and delivery status.
The tactical dashboard (screenshot). The executive dashboard opens with its own button.

HR attrition

Tableau Public / 2023

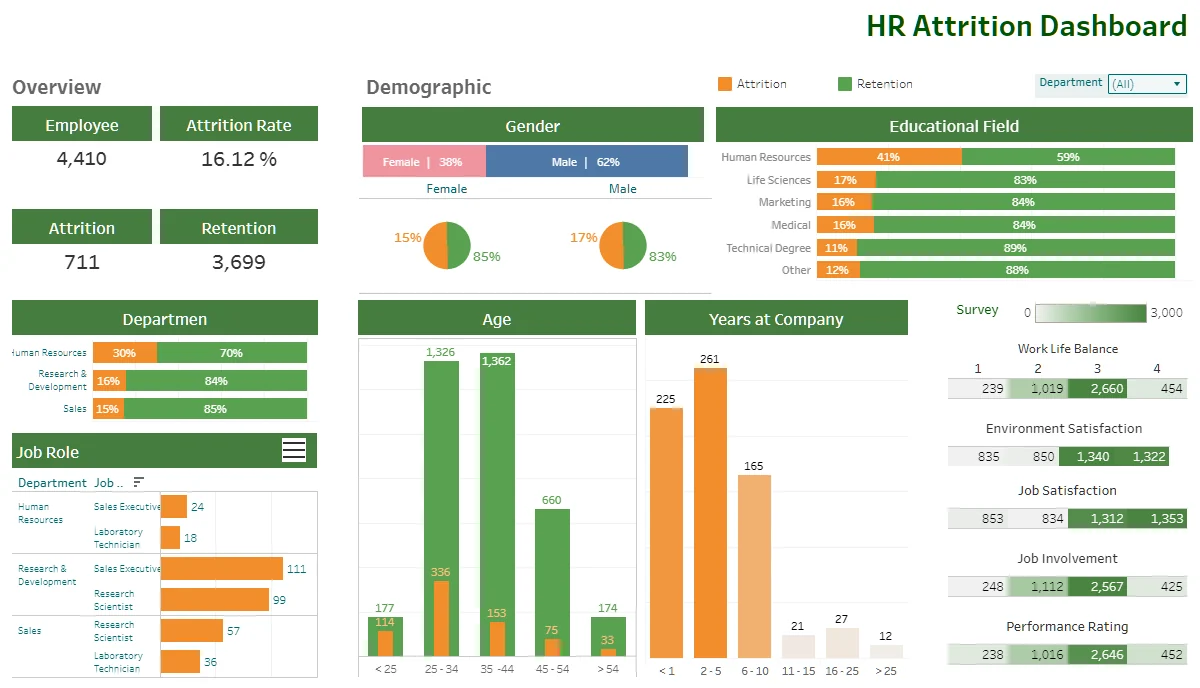
  • Employee count, attrition rate, and attrition against retention.
  • Breakdowns by gender, educational field, department, job role, age band and years at the company.
  • Survey heatmaps for work-life balance, environment and job satisfaction, job involvement and performance rating, with a department filter.

The brief: find which factors to focus on to bring attrition from 15% down to 10% within 12 months.

Green and orange HR attrition dashboard: employee, attrition and retention counts, gender and education breakdowns, department, job role, age and years at company charts, and survey score heatmaps.
HR attrition dashboard (screenshot).

Food security and vulnerability in Indonesia

R Shiny on shinyapps.io / 2025 / team of three

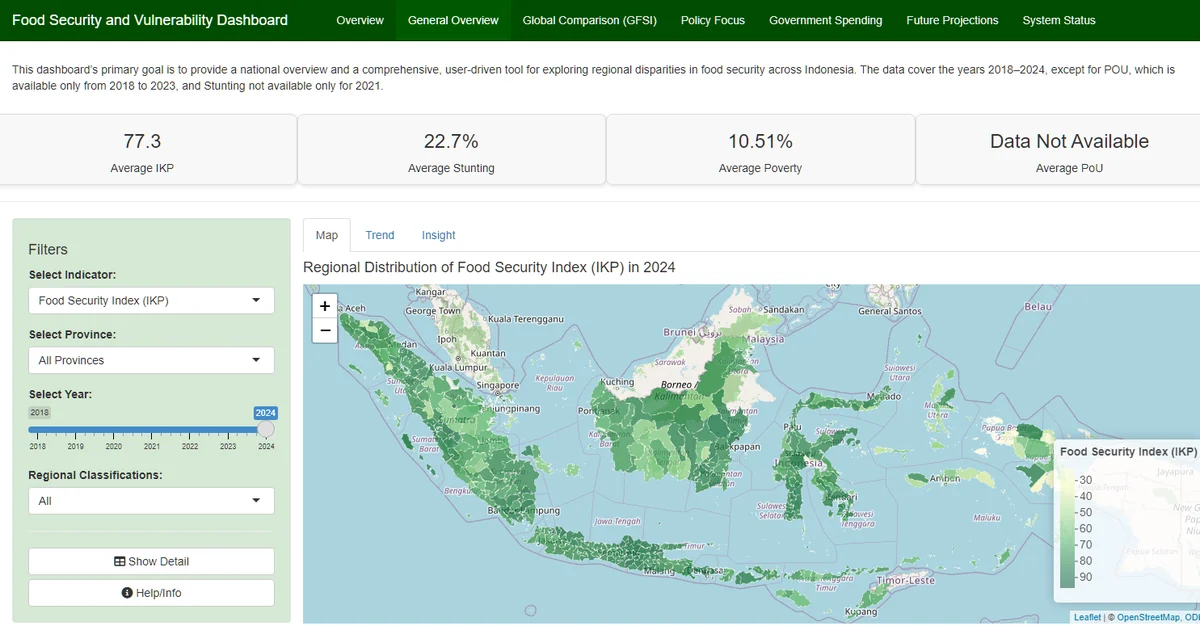
  • District map, trend lines and top and bottom regions for the food security index, stunting, poverty and undernourishment, 2018-2024.
  • Geographically weighted regression to find local drivers of food insecurity, with PCA and K-Means clusters of priority districts.
  • ARIMA forecasts for 2025-2030 against 2030 goals, a global comparison on the Global Food Security Index, and an analysis of agricultural subsidies.

The free hosting plan puts the app to sleep when idle, so the first load can take about ten seconds.

Food security dashboard with a green choropleth map of Indonesian districts coloured by food security index, summary values for average index, stunting and poverty, and filters for indicator, province, year and regional classification.
General overview tab of the R Shiny dashboard (screenshot).